In the vast landscape of global financial markets, Nasdaq is more than just the name of a stock exchange, it is a symbol of technological advancement, innovative spirit, and the pulse of the future economy. For any modern trader aiming to stay ahead of the curve, gaining a deep understanding of this dynamic market is essential. From its revolutionary origins and unique market structure to its key indices, diverse trading instruments, and the invisible forces driving its price movements, the world of Nasdaq is both complex and captivating.
In this fast-paced environment, understanding how Nasdaq operates is a critical first step for both beginners and seasoned traders. This guide will take you on a comprehensive journey, systematically breaking down every facet of Nasdaq.
How Did Nasdaq Become Synonymous with Technological Innovation?
To truly grasp Nasdaq’s essence as a global hub of innovation, we must trace back to its disruptive origins. Its history is not merely a timeline of events but a technological revolution that fundamentally reshaped the financial market landscape, creating a natural home for the world’s most forward-thinking companies.
From Quotation System to Global Electronic Exchange
The Nasdaq Stock Market was officially established on February 8, 1971, founded by the National Association of Securities Dealers (NASD). The name “Nasdaq” originally stood for the National Association of Securities Dealers Automated Quotations. Its creation was driven by a directive from the US Securities and Exchange Commission (SEC), aiming to automate and standardize the over-the-counter (OTC) market, which at the time lacked transparency.
In its early days, Nasdaq was not a trading platform but a revolutionary electronic quotation system. Whiletraditional exchanges relied on delayed ticker tape machines, Nasdaq enabled market makers to update their bid and ask prices in real time via electronic terminals. This significantly improved market transparency and effectively reduced bid-ask spreads. Its fully electronic, non-physical trading floor structure marked a fundamental disruption to the traditional exchange model.
Over time, Nasdaq continuously expanded its functions, incorporating trade execution, volume reporting, and automated trading systems. In 2000 and 2001, its parent organization NASD (now the Financial Industry Regulatory Authority, FINRA) sold its ownership stake, and Nasdaq subsequently went public on its own exchange under the ticker symbol NDAQ on July 2, 2002. In 2006, it officially received regulatory approval to transition from a quotation system into a national securities exchange. To expand its global footprint, Nasdaq merged with Nordic exchange group OMX in 2007 to form the NASDAQ OMX Group, which was renamed Nasdaq, Inc. in 2015.
Inside Nasdaq’s Market Mechanics: Why the Market Maker System Matters?
Nasdaq operates under a market maker system (Dealer Market), also known as a Negotiated Market. This stands in fundamental contrast to the Auction Market model used by the New York Stock Exchange (NYSE), where each stock is typically handled by a single designated market maker (DMM) on a physical trading floor to match buy and sell orders.
By comparison, Nasdaq operates on a decentralized model. It introduces multiple competing market makers for each listed security. Market makers are securities firms or financial institutions whose core responsibility is to provide continuous market liquidity using their own capital and inventory. Specifically, during trading hours, market makers must simultaneously quote both a buy price (Bid) and a sell price (Ask) for their designated stocks and guarantee execution of a specified volume at these prices.
This competitive structure is key to the efficiency of Nasdaq’s trading system. Dozens of market makers compete for investor order flow by continuously adjusting their quotes to offer the most favorable bid-ask spread (Bid-Ask Spread), which naturally promotes more efficient price discovery and lower trading costs.
This competitive market maker model is a direct reflection of Nasdaq’s decentralized, technology-first philosophy. The NYSE’s specialist system is fundamentally centralized, centered around a single point of contact on the physical trading floor. In contrast, Nasdaq operates as a distributed network made up of numerous electronic participants, with no single controlling center—an architecture that aligns closely with modern technological systems like the internet. This structure is not merely a technical detail; it is a core part of Nasdaq’s identity. It creates a more “democratized” and scalable market, where any qualified institution can compete on equal footing. This underlying philosophy makes Nasdaq a more attractive listing venue for innovative companies that are themselves disrupting traditional, centralized industries.
Nasdaq’s Listing Tiers: What Differentiates the Global Select, Global, and Capital Markets?
To attract and serve companies at various stages of growth, Nasdaq strategically divides its marketplace into three distinct tiers: the Nasdaq Global Select Market,the Nasdaq Global Market, and the Nasdaq Capital Market. While all three levels adhere to the same rigorous corporate governance standards, they differ in terms of initial listing requirements, with progressively higher thresholds for financial and liquidity criteria.
Nasdaq Global Select Market: This is Nasdaq’s premier tier, with some of the most stringent financial and liquidity requirements in the world. Listing on this market is regarded as a mark of corporate excellence and industry leadership.
Nasdaq Global Market: Serving as the middle tier, this market is primarily designed for mid- to large-cap companies that already possess significant scale and global presence.
Nasdaq Capital Market: This entry-level market is tailored for smaller and early-stage companies, with a primary focus on helping these growth-oriented firms raise the capital needed for expansion.
This three-tier structure is more than a simple classification—it reflects Nasdaq’s unique business model: a “graduation system” designed to support corporate growth. Traditional exchanges often focus solely on already-established large enterprises, whereas Nasdaq’s tiered framework offers companies at every stage of their life cycle a clear path forward. A promising startup can launch its initial public offering (IPO) on the Capital Market, gradually advance to the Global Market as it scales, and ultimately reach the pinnacle of the Global Select Market. This model transforms the exchange from merely a listing venue into a long-term growth partner, significantly reinforcing Nasdaq’s brand as the premier platform for innovation and expansion.
Decoding the Key Metrics: Which Nasdaq Index Are You Trading?
When you hear “Nasdaq” mentioned in financial news or trading communities, it’s essential to ask a critical question: which one are they referring to? The exchange features two widely recognized flagship indices that, while related, serve very different purposes. Confusing the two is a common mistake, and clearly distinguishing between them is the first step toward informed trading.
Nasdaq Composite Index – The Broad Market Thermometer
The Nasdaq Composite Index, commonly identified by its ticker symbol ^IXIC, is a broad benchmark used to measure the overall performance of the Nasdaq market.
Component Composition: This index includes nearly all common stocks listed on the Nasdaq Stock Market, totaling over 2,500 companies and sometimes cited as more than 3,000. It includes not only US-based firms but also a significant number of international companies, which is a key distinction from the S&P 500.
Weighting Method: It is a market-capitalization-weighted index, meaning that larger companies such as Apple and Microsoft have a greater impact on the index’s overall movement.
Primary Function: Its core purpose is to serve as a broad market thermometer, reflecting the overall health and direction of the entire Nasdaq exchange. When financial media report that “the Nasdaq rose or fell today,” they are usually referring to this Composite Index.
Nasdaq-100 Index – The Arena of Tech Giants
Unlike the broader coverage of the Composite Index, the Nasdaq-100 Index, commonly identified by its ticker symbol NDX, is a more focused and refined benchmark.
Component Composition: This index consists of the 100 largest non-financial companies listed on the Nasdaq by market capitalization.
Excluding financial firms is one of its core design principles, allowing the index to more purely reflect the performance of growth-oriented sectors such as technology, biotechnology, retail, and telecommunications.
Weighting Method: The index uses a modified capitalization-weighted method. This “modification” is critical, it applies specific weighting limits to cap the influence of the largest constituents, preventing the index from being overly dominated by a handful of mega-cap companies.
Index Rebalancing: The Nasdaq-100 Index undergoes a quarterly review and an annual reconstitution each December. Additionally, when the index’s concentration exceeds a predefined threshold, a Special Rebalance may be triggered. A notable example occurred in July 2023, when the combined weight of stocks exceeding 4.5% driven by the surge in the “Magnificent Seven” tech giants surpassed the 48% cap, prompting a special rebalancing. This adjustment redistributed weights but did not add or remove any constituents.
Primary Function: The Nasdaq-100 serves as the underlying benchmark for some of the most popular and highly liquid Nasdaq-related trading products worldwide, including the well-known Invesco QQQ ETF, as well as E-mini (NQ) and Micro E-mini (MNQ) equity index futures.
The Nasdaq-100 Index is not simply a subset of the Composite Index. It is more akin to a financial product meticulously designed for trading. First, the exclusion of financial stocks such as banks and insurers is a deliberate decision intended to filter out traditional “old economy” sectors. This sharpens the index’s focus on technological innovation and high-growth industries, offering investors a more concentrated tool for innovation-themed investing. Second, its modified weighting and rebalancing mechanisms serve as built-in risk management safeguards. Without these features, the index could easily become a proxy for the stock prices of just a few mega-cap companies. The special rebalance in 2023 vividly demonstrated the effectiveness of this mechanism, ensuring the index continues to represent 100 leading companies, not merely five or six. It is this carefully constructed and risk-managed framework that makes the Nasdaq-100 a more stable and liquid underlying asset compared to the Composite Index, making it exceptionally well suited for derivatives such as ETFs and futures. In this sense, the Composite Index functions as the “thermometer” of the entire exchange, while the Nasdaq-100 Index acts as the “engine” that traders truly steer.
How to Participate in the Pulse of the Nasdaq Market?
After clearly identifying Nasdaq’s key indices, the next step is practical application: as an individual trader or investor, how can one gain exposure to the Nasdaq-100 Index? The market offers a variety of financial instruments, each with its own characteristics, advantages, and risks, designed to accommodate different trading strategies, capital sizes, and levels of expertise.
Exchange-Traded Funds (ETFs): The Most Popular Entry Point
Exchange-Traded Funds (ETFs) are funds that trade on exchanges like individual stocks and aim to closely track the performance of a specific index. For investors looking to participate in the Nasdaq market, ETFs offer a direct and convenient way to gain exposure.
Core Product: The most well-known and highly liquid ETF tracking the Nasdaq-100 Index is undoubtedly the Invesco QQQ Trust (ticker symbol: QQQ). It is virtually synonymous with the Nasdaq-100 and is widely followed and traded by investors around the world.
Other Options: Beyond QQQ, the market offers several variants to meet different needs. For example, the Invesco NASDAQ 100 ETF (QQQM) features a lower expense ratio and smaller share price, making it more appealing to investors with limited capital. Meanwhile, the Direxion NASDAQ-100 Equal Weighted Index Shares (QQQE) employs an equal-weight strategy, distributing weight evenly across all 100 constituents to reduce the risk of overconcentration in large-cap tech stocks.
Thematic ETFs: In addition to directly tracking the index, investors can also gain targeted exposure to specific high-growth sectors within Nasdaq through thematic ETFs. For example, biotech-focused ETFs such as IBB, BBH, and ARKG, as well as semiconductor-focused ETFs like SOXX, include a large number of Nasdaq-listed companies, allowing investors to concentrate on the niche sectors they believe in.
Index Futures: A Leveraged Tool for Professional Traders
Index futures are standardized financial contracts that allow traders to buy or sell a stock index at a predetermined price on a specified future date, enabling speculation on or hedging against the index’s future direction.
Primary Contracts: The main Nasdaq-100 index futures traded on the Chicago Mercantile Exchange (CME) come in two sizes: the E-mini Nasdaq-100 (contract code: NQ) and the Micro E-mini Nasdaq-100 (contract code: MNQ).
Contract Specifications: For the standard NQ contract, each 1-point movement in the index represents a $20 change in value. The MNQ contract is one-tenth the size of the NQ, meaning each 1-point movement equals a $2 change. This lower capital requirement allows retail traders to participate more easily in the futures market. Both contracts have a minimum tick size of 0.25 index points, corresponding to a value change of $5 for NQ and $0.50 for MNQ.
Key Advantages:
High Leverage: Futures trading operates on a margin system, allowing traders to control a full contract with only a fraction of its total value (margin). This significantly enhances capital efficiency and amplifies potential returns.
Nearly 24-Hour Trading: The futures market is open five days a week and operates almost around the clock, enabling traders to react in real time to global news and events even when the US market is closed.
Excellent Liquidity: NQ futures are among the most liquid financial instruments in the world, with massive daily trading volume that ensures fast and efficient order execution.
Tax Advantages (US-based): Under Section 1256 of the US Internal Revenue Code (IRS), gains from index futures typically benefit from favorable tax treatment, with 60% taxed as long-term capital gains and 40% as short-term capital gains a major advantage for short-term traders.
Contracts for Difference (CFDs): A Double-Edged Sword for Flexible Trading
CFDs are financial derivatives representing an agreement between a trader and a broker to settle the difference in value of an asset (such as the Nasdaq-100 Index) between the opening and closing of a position.
No Ownership of the Underlying Asset: At no point does the trader actually own the underlying asset. Instead, they are purely speculating on its price movement.
Trading Flexibility: CFDs make it exceptionally simple and direct to go long (expecting prices to rise) or go short (expecting prices to fall).
High Leverage: Like futures, CFDs are highly leveraged products. This means that both potential profits and losses are magnified, making them extremely risky.
Trading Costs: The primary costs of trading CFDs come from the bid-ask spread (Spread) and overnight financing charges (Financing Charges) for holding positions overnight.
Regulatory Note: It is important to note that while CFDs are widely popular in Europe, Asia, and other regions, retail traders are prohibited from trading CFDs in the United States.
The choice of trading instrument is a strategic decision in itself, deeply reflecting a trader’s goals, time horizon, risk tolerance, and capital base. For long-term investors and beginners, ETFs offer direct, unleveraged exposure with a simple structure and relatively lower risk, making them an ideal entry point. For active day traders and swing traders, futures combine high leverage, deep liquidity, and nearly 24-hour trading, making them a professional tool for those seeking precision and speed. CFDs, on the other hand, are designed for short-term speculators. With high flexibility and leverage, they cater to those aiming for quick returns with small capital. However, the potentially high costs and risks associated with leverage mean CFDs are suitable only for experienced traders who are well-versed in risk management. These three instruments form a clear hierarchy based on risk and complexity, allowing different types of market participants to find the most suitable way to engage with the Nasdaq-100.
What Are the Key Forces Driving the Nasdaq?
The value of the Nasdaq Index does not fluctuate in a vacuum. Every rise and fall reflects a complex interplay between powerful macroeconomic forces, the financial health of its constituent companies, and the often unpredictable dynamics of collective human psychology. To navigate this market effectively, one must understand the winds and currents that drive it.
As an index dominated by growth stocks, the Nasdaq is highly sensitive to changes in macroeconomic data, especially indicators that influence the monetary policy of the US Federal Reserve (the Fed).
Federal Reserve Interest Rate Policy: The Nasdaq is highly sensitive to interest rate changes. When the Fed raises rates, borrowing costs for companies increase. More importantly, the discount rate used by investors to value stocks also rises. This has a particularly negative impact on growth-oriented tech companies, whose valuations are largely based on expected earnings far into the future. Conversely, rate cuts are typically seen as a strong tailwind for the Nasdaq.
Inflation Data (CPI): The Consumer Price Index (CPI) is a key inflation metric closely watched by the Federal Reserve. A CPI reading that comes in higher than expected often triggers market concerns that the Fed may need to implement tightening measures, such as rate hikes, to cool the economy—putting pressure on the Nasdaq.
Employment Report (NFP): The Non-Farm Payrolls (NFP) report is a critical indicator of the health of the US economy. A strong NFP report is a double-edged sword: on one hand, it signals economic strength, which supports corporate earnings; on the other hand, an overly strong labor market may fuel inflation expectations, increasing the likelihood of Fed rate hikes and placing downward pressure on the Nasdaq.
Earnings Season: How Do Tech Giants’ Results Move the Market?
Earnings season refers to the period following the end of each fiscal quarter when publicly listed companies release their financial results.
Key Metrics: Investors pay close attention to a company’s revenue, EPS (Earnings Per Share), profit margins, and crucially, its forward guidance — management’s forecasts of future performance.
Market Reaction: Volatility typically spikes during earnings season. When a company beats analyst expectations (“beat”) or falls short (“miss”), its stock price often reacts sharply.
Influence of Giants: Because the Nasdaq-100 is market-cap weighted, earnings reports from its largest constituents such as the “Magnificent Seven” tech giants carry outsized influence. A single strong or weak report from one of these companies can significantly lift or drag down the entire index.
Geopolitics and Global Events: Hidden Risks in the Tech Supply Chain
In today’s globalized world, conflicts in any region can ripple across global markets.
Sources of Uncertainty: Geopolitical events such as war, trade disputes (e.g., the US-China tech war), international sanctions, and political instability inject significant uncertainty into the markets.
Vulnerability of the Tech Sector: The technology industry is particularly fragile due to its highly globalized and complex supply chains. Many critical components, such as advanced semiconductor chips, are heavily concentrated in politically sensitive regions like Taiwan. Any disruption to these supply chains can lead to production delays, component shortages, and soaring costs, directly impacting the revenue and profits of Nasdaq’s leading companies.
Investor Sentiment and Narrative: The Psychology Behind Tech Stock Bubbles
Beyond cold data, markets are profoundly influenced by human emotion.
Narrative Economics: A theory proposed by Nobel laureate Robert Shiller, it suggests that emotionally resonant public narratives or stories are powerful forces behind economic fluctuations and market bubbles. Nasdaq has long been at the heart of such narratives, from the “Internet Revolution” to the “Age of Artificial Intelligence”. These stories have deeply shaped investor behavior.
Investor Sentiment: The collective emotions of market participants—optimism, pessimism, or fear—are direct drivers of market volatility. Positive sentiment can lead to overvaluation and fuel asset bubbles, while negative sentiment may trigger panic selling.
Bubble Psychology: Speculative bubbles, such as the late-1990s dot-com bubble, often follow five stages: Displacement, Boom, Euphoria, Profit-Taking, and Panic. The psychological forces behind these stages include fear of missing out (FOMO), overconfidence, and herd behavior. These irrational drivers can cause asset prices to deviate significantly from their intrinsic value.
What Is Nasdaq’s Role Among the Three Major US Stock Indexes?
To truly appreciate Nasdaq’s distinct character, it must be viewed in a broader context. By comparing it with its older and more traditional counterparts—the S&P 500 and the Dow Jones Industrial Average—we can observe not only differences in stock composition but also the contrasting philosophies behind how each index is constructed.
Constituents and Weighting: Tech Growth vs. Broad Market vs. Blue-Chip Stability
The most fundamental difference among the three major indexes lies in how their constituent stocks are selected and weighted.
Nasdaq Composite Index: Among the three, it has the widest coverage, including over 2,500 stocks. It uses a market-capitalization weighting method and is heavily tilted toward the technology sector.
S&P 500 Index: Composed of 500 large US companies carefully selected by a committee, it also uses a market-capitalization weighting method. Its design aims to serve as a broad and diversified representation of the US economy, covering approximately 80% of the total US stock market capitalization.
Dow Jones Industrial Average (DJIA): This is an elite club of 30 major US “blue-chip” companies. Its most distinctive feature is the use of a price-weighted calculation method. This means companies with higher share prices—regardless of their total market capitalization—have a greater influence on the index, making it a very unique mechanism.
Sector Distribution: Why Is Nasdaq More Concentrated by Industry?
Differences in sector composition further highlight the distinct roles of the three major indexes.
Nasdaq-100 Index: Its high sector concentration is by design. The combined weight of the Information Technology and Consumer Discretionary sectors typically accounts for the vast majority of the index. More notably, it has zero exposure to the financial sector. As of Q1 2024, technology stocks alone made up nearly 60% of the index.
S&P 500 Index: Its sector distribution is much broader and more balanced. While Information Technology remains the largest sector (typically accounting for 27–30%), other sectors such as Financials, Health Care, Industrials, and Consumer Discretionary also hold significant weights, offering a more comprehensive snapshot of the overall economy.
Dow Jones Industrial Average: Although its 30 companies span multiple industries, the limited number of constituents means its sector representation is not as systematic or comprehensive as that of the S&P 500.
Long-Term Performance and Risk Assessment: Balancing Return and Volatility
Historical data shows that the distinct positioning of each index leads to markedly different risk-return profiles.
Historical Performance: Over the long term, especially during bull markets driven by technological innovation the Nasdaq Index has typically delivered higher returns. However, these high returns come with greater risk. During bear markets, its declines are often steeper. For example, after the bursting of the dot-com bubble, the Nasdaq Index dropped by more than 80% at one point.
Volatility: Nasdaq’s volatility has consistently been higher than that of the S&P 500 and the Dow Jones Industrial Average, a well-established market consensus.
Risk-Adjusted Return (Sharpe Ratio): Despite its higher volatility, the Nasdaq-100 Index has historically recorded a higher Sharpe ratio than the S&P 500. The Sharpe ratio measures excess return per unit of risk taken. A higher Sharpe ratio indicates that the Nasdaq’s excess returns have largely compensated for its added risk, demonstrating superior risk-adjusted performance.
These three major indexes embody three distinct investment philosophies, each reflecting a different economic narrative. Nasdaq represents an investment in disruptive growth and future innovation. It is a high-risk, high-potential-return choice suited for investors who firmly believe that technology will continue to reshape the world.
The S&P 500 stands for an investment in the broader US corporate economy. It is a classic core asset, offering balanced exposure to both growth and value segments, and serves as a benchmark for American capitalism itself. The Dow Jones represents an investment in mature, stable blue-chip companies. It is a curated list of industrial and consumer giants. Its unique price-weighted methodology makes it more of a time-honored barometer of market sentiment surrounding iconic American companies, rather than a precise tool for measuring the overall economy.
Advanced Trading Insights: What Key Nasdaq Characteristics You Should Know?
For traders aiming to sharpen their edge, the Nasdaq ecosystem offers a set of unique trading features and specialized market indicators that reveal deeper market dynamics. Understanding these advanced concepts—namely extended trading hours and volatility indexes—is essential for navigating this fast-moving, information-driven market.
Pre-Market and After-Hours Trading: How to Leverage Extended Hours?
One of the notable features of the US stock market is its extended-hours trading, which allows trading outside the regular market session (9:30 AM to 4:00 PM Eastern Time).
Definition and Timing: Extended hours include pre-market trading, which can start as early as 4:00 AM ET, and after-hours trading, which can continue until 8:00 PM ET.
Trading Mechanism: Transactions during these sessions are matched through Electronic Communication Networks (ECNs), rather than the primary exchange’s standard trading infrastructure.
Strategic Importance: Extended-hours trading is especially significant for Nasdaq, as many market-moving events such as quarterly earnings reports, key economic data releases, and merger announcements—are often published outside of regular trading hours. This provides traders with the opportunity to react to new information immediately.
Risks and Rules: Traders must be aware that these sessions involve significantly lower liquidity and higher volatility. This often results in wider bid-ask spreads, and orders may be only partially filled or not executed at all. As a result, most brokers only accept limit orders during extended hours to protect traders from unfavorable price execution.
Measuring Market Fear: How to Interpret the Nasdaq Volatility Index (VXN)?
Beyond price itself, market “sentiment” can also be quantified. The Nasdaq Volatility Index (VXN) serves as a key gauge of that sentiment.
Definition: VXN stands for the CBOE Nasdaq-100 Volatility Index. Often referred to as the “tech fear index”, it is the Nasdaq-focused counterpart to the more widely known VIX, which tracks volatility expectations for the S&P 500.
Calculation Method: VXN does not measure historical volatility. Instead, it reflects the market’s expectations for implied volatility over the next 30 days. This expected value is derived through a complex mathematical model based on the real-time prices of call and put options on the Nasdaq-100 Index.
How to Interpret It:
High VXN Reading: Indicates extreme fear among investors and an expectation of significant price swings ahead. For contrarian investors, extreme fear is often seen as a potential bottoming signal, suggesting a possible buying opportunity.
Low VXN Reading: Reflects widespread investor optimism or complacency, with expectations of a calm market. Excessive complacency may serve as a warning sign that the market is nearing a top.
VXN vs. VIX: Because the Nasdaq-100 Index is heavily weighted toward tech stocks, which are inherently more volatile than the broader and more diversified S&P 500, VXN readings are typically higher than those of VIX.
Conclusion: Navigate Nasdaq, Harness the Pulse of Future Innovation
Nasdaq is more than just a stock exchange, it is an innovation-driven ecosystem. Navigating this market requires a multidimensional understanding. Traders must grasp the direction of macroeconomic policies, assess corporate fundamentals, and deeply understand the powerful influence of market narratives and collective investor psychology.
Riding the waves of the Nasdaq market demands a perfect blend of knowledge, tools, and cost-efficiency. Cashback Island is committed not only to helping you reduce trading costs through cash rebates, but also to becoming a strong partner in your investment journey. Our in-depth educational guides, professional calculation tools, and real-time market intelligence are designed to give you greater clarity helping you move more confidently and further on your path of investing in technology and innovation.
Cashback Island continuously updates its forex trading education resources. Traders can visit the “Cashback Island Teaching Guide” section to learn about liquidity management, volatility strategies, and rebate optimization techniques.
Frequently Asked Questions
Q1. What is the key difference between the Nasdaq-100 index and the composite index?
The Nasdaq-100 Index selects the top 100 non-financial companies by market capitalization (such as Apple and Microsoft), offering a concentrated view of major tech giants. The Composite Index includes all 5,000+ listed companies on the exchange, encompassing financial firms and small- to mid-cap businesses.
Q2. How often are Nasdaq index components updated?
The index undergoes a rebalancing on the third Friday of December each year. Companies that fall out of the top 150 by market capitalization are removed, and eligible new companies are added.
“Forex trading involves high risk and may result in capital loss. The content of this article is for informational purposes only and does not constitute investment advice. Please make decisions carefully based on your personal financial situation. Cashback Island assumes no responsibility for any trading-related outcomes.”
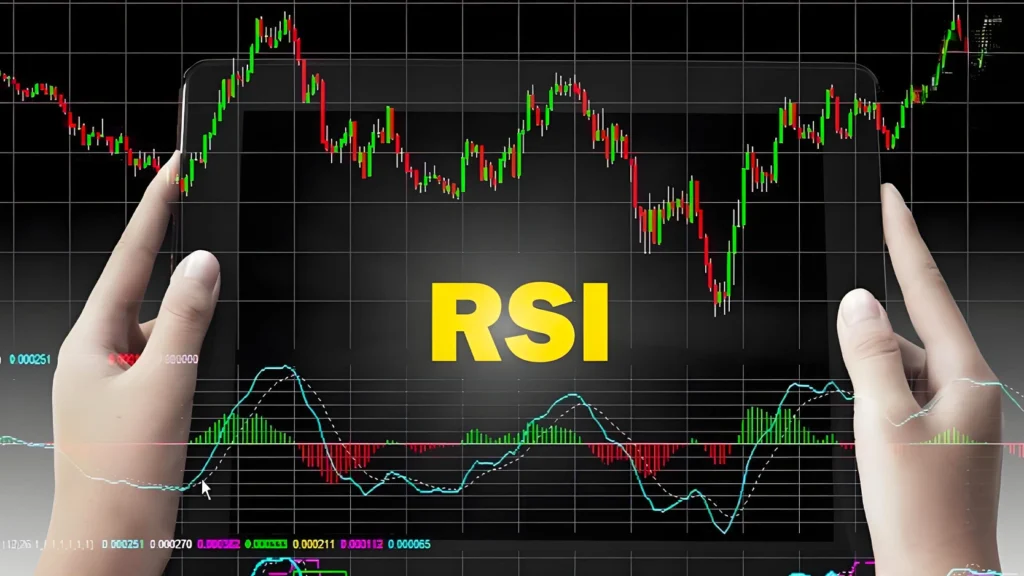
In the realm of modern financial market analysis, whether it’s the fast-changing forex market, the highly volatile cryptocurrency space, or traditional stock indices, technical analysis plays an indispensable role. Among the many technical indicators, the Relative Strength Index (RSI) is undoubtedly one of the most classic and widely used tools....
In today's environment of persistently low interest rates combined with inflationary pressures, simply depositing money in the bank is no longer sufficient to preserve the future value of your assets. An increasing number of investors are seeking more proactive ways to grow their wealth, shifting from traditional savers to active...
In financial market terminology, “bottom-fishing” is a highly enticing yet challenging concept. It refers to an investment strategy aimed at buying assets that have undergone significant price declines and are believed to be undervalued, with the expectation that their prices will eventually rebound sharply. This strategy embodies the ultimate expression...