In financial market terminology, “bottom-fishing” is a highly enticing yet challenging concept. It refers to an investment strategy aimed at buying assets that have undergone significant price declines and are believed to be undervalued, with the expectation that their prices will eventually rebound sharply. This strategy embodies the ultimate expression of the age-old investment principle of “buy low, sell high”. When markets are gripped by fear and asset prices appear to be falling without end, the idea of buying at the very bottom before the dust settles can seem like a shortcut to substantial profits.
However, reality is far more complex than theory. Bottom-fishing is not a game of luck, nor is it about blindly “catching a falling knife”. Markets tend to overreact out of fear due to short-term negative news, industry headwinds, or macroeconomic uncertainty. Successful bottom-fishers don’t rely on gut feelings. They operate within a disciplined analytical framework backed by rigorous research and unwavering discipline. Their goal is to distinguish between temporarily troubled “fallen heroes” and “value traps” whose fundamentals have broken down and are likely headed for failure.
What Technical Signals Are Needed for Successful Bottom-Fishing?
Turning theory into practice, traders need tools to decode the language of the market. Technical analysis serves exactly this purpose. By studying historical price and volume data, it helps us uncover signs of shifting sentiment and clues that selling pressure may be fading and buying interest quietly building. While no single indicator can predict a market bottom with absolute accuracy, using multiple signals in combination allows traders to construct a more reliable analytical framework and improve the chances of spotting a potential reversal. These tools are not crystal balls for seeing the future, they are precision instruments for measuring market momentum, volatility, and shifts in supply and demand.
Identifying Oversold Conditions and Momentum Shifts Through Indicators
One of the most critical tasks during a downtrend is determining whether selling momentum has been exhausted. Momentum oscillators play a vital role in this process. These indicators measure the speed and magnitude of price movements, helping traders identify whether the market has entered an emotionally driven “oversold” state.
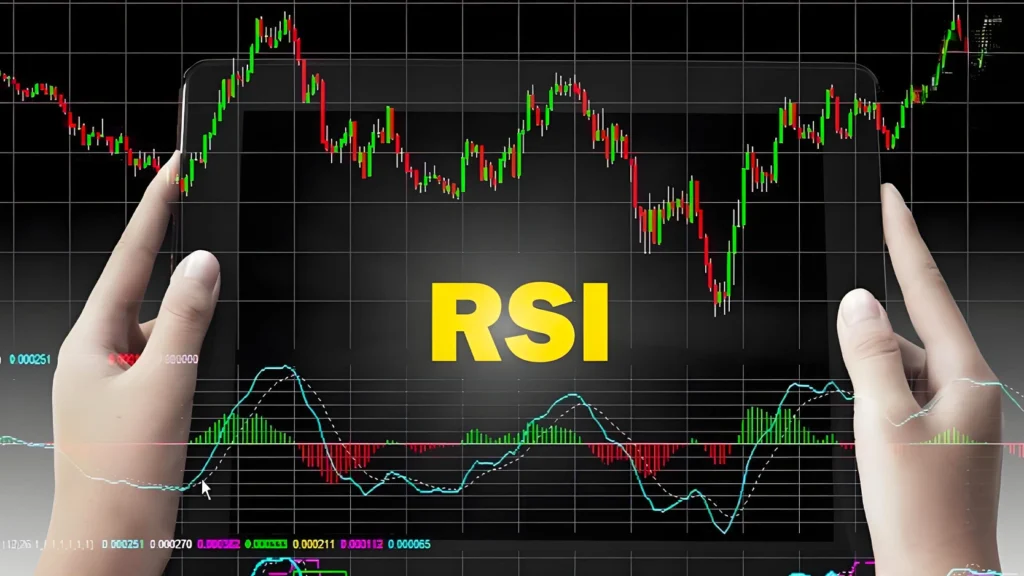
First is the Relative Strength Index (RSI), a momentum oscillator that fluctuates between 0 and 100. Traditionally, when an RSI reading below 30 is considered oversold, indicating that the asset has faced intense recent selling pressure and the speed and magnitude of its decline may be overdone, suggesting potential for a rebound. However, relying solely on this fixed threshold can be risky, as assets in strong downtrends may remain in the oversold zone for extended periods. A more reliable and powerful signal is a bullish divergence, a situation where the asset’s price hits a new low, but the RSI fails to follow suit and instead forms a higher low. This is a key signal suggesting that, despite falling prices, the downward momentum is weakening and selling pressure is beginning to fade.
Next is the Moving Average Convergence Divergence (MACD), a trend-following momentum indicator composed of three elements: the MACD line, the signal line, and a histogram. Unlike RSI, MACD does not have fixed overbought or oversold levels. Its bottom-fishing signals primarily come from the relative positioning of the two lines. A key bullish signal is when the MACD line crosses above the signal line from below, forming what is known as a “golden cross”. This is often interpreted as short-term momentum overtaking long-term momentum, suggesting the market may be transitioning from bearish to bullish, or at least preparing for a strong rebound. When this crossover occurs after a significant price decline or in conjunction with a bullish divergence, the signal’s reliability is considerably strengthened.
Finally, Bollinger Bands offer insights into market conditions through the lens of volatility. This indicator consists of a moving average line flanked by upper and lower bands based on standard deviations. When the price touches or falls below the lower band, it suggests that the price has deviated significantly from its recent average, placing it in a relatively oversold condition. However, this alone is not a buy signal, it is a cautionary flag. A more robust approach is to combine Bollinger Bands with the RSI. For example, if the price hits the lower Bollinger Band while the RSI simultaneously shows a reading below 30, the mutual confirmation of these two indicators from different dimensions significantly enhances the credibility of an impending price rebound.
Interpreting Bottom-Fishing Signals from Key Technical Indicators
Indicator
Bullish Signal
Interpretation
Key Considerations
Relative Strength Index (RSI)
Reading below 30; bullish divergence (price makes new low, RSI forms a higher low)
Selling momentum may be exhausted, and downside pressure is weakening.
In strong downtrends, RSI can stay below 30 for an extended period. Divergence offers a more reliable signal than standalone readings.
Moving Average Convergence Divergence (MACD)
MACD line crosses above signal line (bullish crossover)
Short-term momentum begins to overtake long-term momentum, indicating a possible trend reversal.
MACD is a trend-following indicator and may lag. It performs better when used in combination with other indicators.
Bollinger Bands
Price touches or falls below the lower band.
Price is relatively oversold compared to recent volatility levels.
Price may continue to slide along the lower band (known as “riding the band”). Confirmation with momentum indicators like RSI is recommended.
Identifying Bottom Signals Through Price and Volume
Beyond mathematically derived oscillators, the market’s most fundamental data—price and volume—carries a wealth of information on its own. A true market bottom is often marked by a subtle yet decisive shift in control, where selling pressure has been fully exhausted and buying strength begins to quietly take over.
In terms of price action, a classic bottom reversal pattern is the double bottom (also known as a “W-bottom”). Within bottom-fishing strategies, one notable variation of the “W-bottom” to watch for is when the second low is higher than the first. This structure is particularly meaningful: it indicates that during the second dip, sellers no longer have sufficient strength to push the price below the previous low. This suggests that selling pressure is weakening, while buyers are stepping in more aggressively at a higher level, providing support. It marks an early sign of a shift in market sentiment from pessimism to cautious optimism.
Volume is the key to confirming the validity of price action. A healthy market bottom is often accompanied by a distinct volume pattern. During the decline and base-building process, one highly important signal is persistent volume contraction. When prices consolidate at low levels and volume becomes extremely light, it is often referred to as “volume exhaustion”, it suggests that panic sellers have largely exited and supply pressure in the market has been significantly reduced. In contrast, when the price eventually breaks above a key resistance level, the move should be accompanied by a notable surge in volume. This indicates that buying power is strong enough to absorb any remaining selling pressure, signaling the potential start of a new upward trend.
In addition, subtler price behaviors can also offer valuable clues. For example, tight weekly closes within a bottom consolidation zone are a strong indicator. This pattern means that despite considerable intraday or intraweek volatility, the closing price consistently falls within a narrow range. Such behavior often points to large institutional investors quietly accumulating positions in that area. They take advantage of market fluctuations to buy and then keep prices within a controlled band before the close, effectively preventing further declines.
How to Use Fundamental Analysis to Evaluate Bottom-Fishing Opportunities Beyond Technicals?
Technical analysis helps answer the question of “when” might be a good time to enter, but it cannot address a more fundamental question: “what” assets are worth bottom-fishing. The market is full of stocks that have plunged in price, but many of them are “value traps” that deserve to be eliminated. To identify those temporarily out-of-favor yet fundamentally “strong assets” with long-term recovery potential, fundamental analysis is essential. This involves a deep examination of a company’s financial health, industry position, and future prospects, allowing us to assess its intrinsic value and make more informed investment decisions.
Assessing a Company’s Intrinsic Value and Financial Health
Before deciding whether a stock is “cheap”, the first priority is to determine whether the underlying company is “healthy”, meaning it has the resilience to weather the current crisis. This process is much like giving a patient a full medical examination before evaluating their long-term potential.
Valuation is a core step in the process, and the Price-to-Earnings Ratio (P/E Ratio) is one of the most widely used and intuitive valuation tools. The P/E ratio reflects how much the market is willing to pay for each unit of a company’s earnings. A lower P/E ratio may suggest that a stock is undervalued, but this figure in isolation is meaningless. To make it useful, comparative analysis is essential:
Comparison with Historical Levels: Compare the company’s current P/E ratio with its historical range over the past three to five years. If the current figure sits at the lower end of that range, it may indicate undervaluation.
Comparison with Industry Peers: Compare the company’s P/E ratio with those of similar-sized competitors in the same industry. If it is significantly below the industry average, this may also signal relative undervaluation.
However, the analytical process for a bottom-fishing strategy follows a critical sequence. Many novice traders are drawn to low P/E ratios and jump straight into valuation analysis which is a common mistake. A company’s low P/E ratio may exist precisely because it is burdened with heavy debt, has cash flow on the brink of collapse, and the market has already priced in its high bankruptcy risk. Therefore, a more rigorous and safer approach is to use a two-stage screening process. The first stage is a survivability check, assessing the company’s financial health. This includes analyzing the Debt-to-Equity (D/E) Ratio, where an excessively high D/E ratio is a highly dangerous red flag during an economic downturn. At the same time, review the company’s cash flow statement to ensure it maintains stable, positive operating cash flow to sustain its operations.
The second stage is valuation screening. Only after confirming that a company has the financial strength to survive should valuation tools such as the P/E ratio that can be applied to this “survivor pool” to identify truly high-quality and attractively priced investment opportunities.
Finding “Fallen Heroes” with Long-Term Potential
Numbers and ratios provide quantitative evidence, but whether a company can not only survive a crisis but also regain its vitality depends on qualitative factors that are harder to measure. The art of bottom-fishing lies in identifying companies with enduring competitive advantages that are merely experiencing temporary setbacks.
Successful bottom-fishers look for companies with solid long-term prospects that are currently facing short-term challenges. These challenges may stem from a poor quarterly earnings report, macroeconomic fluctuations, or a temporary industry downturn—rather than irreversible, fundamental issues in the company’s core business.
A core concept in assessing long-term potential is the economic moat which indicates the sustainable competitive advantage that protects a company from erosion by competitors. Economic moats can take many forms, such as: strong brand loyalty, exclusive patented technology, high customer switching costs, or unmatched cost advantages. A wide moat safeguards the company’s future profitability, enabling it to recover lost ground more quickly during an economic rebound and even expand its market share.
Besides, management quality is equally critical. An experienced, trustworthy management team is one of a company’s most valuable assets. In bottom-fishing analysis, it is essential to assess whether management has a proven track record of successfully navigating crises, whether their industry judgment is accurate, and whether they remain focused on creating long-term shareholder value even in adversity. A company with capable leadership at the helm is clearly more likely to steer through the storm and reach brighter days.
How Have Market Bottoms Formed Throughout History?
Theoretical analysis provides a framework, but real historical cases bring that framework to life with context and nuance. A review of past major market crashes shows that the formation of market bottoms is far from uniform. The root cause of each crisis—whether stemming from structural issues within the financial system or triggered by external shocks—profoundly shapes the speed of the decline, the process of bottoming, and the path to eventual recovery. For any trader attempting to bottom-fish, understanding these differences is essential.
2008 Global Financial Crisis: A Prolonged Bottoming in a Systemic Meltdown
The 2008 global financial crisis was a textbook example of a systemic crisisoriginating from the very core of the financial system. Its roots lay in the US housing bubble, loose lending standards that fueled a surge in subprime mortgages, and the creation of complex, poorly regulated financial derivatives based on those loans, (such as credit default swaps, CDS). When the housing bubble burst, the value of these toxic assets collapsed, triggering a chain reaction across the global banking system and sparking a full-blown crisis of confidence.
What defined this crisis was its long and painful bottoming process. From the market peak in October 2007, it took 17 months to reach the ultimate bottom on March 9, 2009. During this period, the Standard and Poor 500 (S&P 500) lost more than 50% of its market value. From the collapse of Lehman Brothers in September 2008 to the March 2009 trough, markets were gripped by extreme volatility and fear. Investors swung repeatedly between fleeting hope from government rescue programs and despair from the relentless failures of financial institutions, with multiple short-lived rallies ultimately proving to be “false dawns”.
In crises that originate within the financial system and are triggered by excessive leverage and bad debt, the resolution inevitably involves a slow process of “deleveraging”. The financial system needs time to clear bad debts, repair balance sheets, and rebuild capital. As a result, market bottoms in such scenarios tend to form a classic “U-shape” or “W-shape”. They are not precise points that can be easily pinpointed but rather prolonged, uncertain phases. When the root cause lies in structural issues within the financial system, bottom-fishing requires immense patience and the ability to withstand significant volatility.
2020 COVID-19 Crash: A V-Shaped Reversal After an External Shock
In sharp contrast to 2008, the 2020 market crash was triggered by an exogenous shock—the global COVID-19 pandemic. Prior to the outbreak, global economic fundamentals were relatively sound, with no evident asset bubbles or systemic financial risks. The immediate cause of the crisis was the sweeping lockdown measures imposed by governments worldwide to contain the spread of the virus, which abruptly halted global economic activity.
The market reaction to this crisis displayed distinctly different characteristics. First was the unprecedented speed and depth of the decline, the S&P 500 plunged about 34% in just 34 days, marking one of the fastest bear markets in history. Second was the V-shaped recovery. After hitting bottom, markets rebounded sharply, with global equities re-entering bull market territory by April 2020, only a month after the trough.
This rapid recovery was driven by unprecedented, swift, and large-scale policy interventions by governments and central banks, most notably the US Federal Reserve (Fed). Within just two weeks, the Fed cut interest rates to zero, restarted and expanded its quantitative easing (QE) program without limit, and launched multiple emergency lending facilities, injecting massive liquidity into the market and effectively providing a strong “safety net” for the financial system.
The 2020 case illustrates a different type of market bottom. When a crisis stems from an external shock and the underlying economic fundamentals remain intact, confidence can rebound quickly if policy responses are both timely and forceful. In such situations, the market bottom often takes the sharp “V shape”, with a very narrow window of opportunity for bottom fishing. Investors waiting for a prolonged bottom-building process like in 2008 would likely miss the entire rebound.
Comparison of Market Bottom Characteristics: 2008 vs 2020
Slow: S&P 500 took about 4 years to return to pre-crisis highs.
Very fast: recaptured most losses within months and hit new highs within the same year.
Why Is Risk Management the Decisive Factor in the Success or Failure of a Bottom-Fishing Strategy?
After examining the technical, fundamental, and historical aspects of bottom-fishing, we must return to the most critical element that determines the success or failure of this strategy —risk management. Bottom-fishing is inherently a contrarian approach, attempting to pinpoint a turning point within a strong downtrend. This means traders will inevitably make mistakes. The market can fall much deeper than anyone expects, and what appears to be a perfect bottom signal can fail easily. In such a highly uncertain environment, without an ironclad discipline to control losses, even several successful trades can be wiped out by a single catastrophic failure. Therefore, risk management is not an optional supplement to a bottom-fishing strategy, it is the very foundation on which its survival depends.
Define Your Risk: Position Sizing and Stop-Loss Placement
Professional risk management is not based on intuition but a precise discipline grounded in mathematics. It rests on two closely interconnected and indispensable concepts: stop-loss placement and position sizing. Together, they form a complete risk equation that ensures traders know in advance, before entering a trade, “If I’m wrong, how much will I lose at most?”
The first and most critical step is to determine your stop-loss level before you enter the trade. A stop-loss is the price point at which you exit the position because the market has proven your trade thesis wrong. This level should be determined based on technical analysis, not simply on the amount of money you are willing to lose. For example, it may be set just below a key support level or beneath the lowest point of a bottom formation. Once you have identified the stop-loss price, you can calculate the potential loss per share (i.e., the difference between the entry price and the stop-loss price).
The second step is to determine the total amount of capital you are willing to risk on a single trade. A widely accepted guideline among professional traders is the “1–2% rule”, meaning that you should never risk more than 1% to 2% of your total trading capital on any single position. For example, if your trading account is $25,000, applying the 2% rule means your maximum allowable loss on any trade is $500.
The final step is to calculate your position size based on your total risk and per-share risk. This is not a matter of guesswork, but a simple mathematical formula:
Position Size (number of shares) = (Total Account Capital × Risk Percentage) / (Entry Price – Stop-Loss Price)
For example: suppose you have an account with $25,000 and decide to risk a maximum of 2% per trade (which equals $500). You identify a stock you wish to buy at $225, with a stop-loss placed at $195 based on your technical analysis. In this case:
Your maximum risk per trade = $500
Your risk per share = $225 − $195 = $30
Your ideal position size = $500 / $30 ≈ 16.67 shares
Therefore, you would buy 16 shares. If the market unfortunately hits your stop-loss, your total loss would be 16 shares × $30 per share = $480, which is within your $500 risk limit. This process transforms risk management from a vague concept into a concrete, executable operation.
The essence of this method lies in minimizing emotional interference in trading decisions. Your position size is no longer determined by greed or fear, but by a mathematical result derived from the market’s technical structure and your pre-set risk plan. This mechanical, systematic approach is crucial for long-term survival when employing high-risk strategies such as bottom fishing.
Conclusion
Successful bottom fishers are not aiming to capture the absolute lowest price in every trade. Instead, they strive to win in a broader probability game. Through strict discipline, they ensure that losses from incorrect judgments are small and manageable, while gains from correct calls are sufficient to offset all losses and generate substantial profits.
This path is filled with uncertainty and demands that traders possess a passion for continuous learning, resilience in facing losses, and unwavering confidence in their strategies. For serious traders committed to this pursuit, having a platform that offers comprehensive support is critical. Cashback Island not only helps traders reduce long-term trading costs and gradually enhance net returns through its financial trading rebate services, but also provides professional calculation tools and timely market intelligence. These resources deliver the data support and decision-making assistance needed when executing complex strategies such as bottom fishing, making Cashback Island a reliable partner for navigating the volatile waters of the market with confidence.
Cashback Island continuously updates its forex trading educational resources. Traders can visit the “Cashback Island Trading Guide” section to master liquidity management, volatility strategies, and rebate optimization techniques.
Frequently Asked Questions
Q1. What exactly is bottom fishing? How does it differ from a regular dip-buying strategy?
Bottom fishing refers to buying assets in the market’s bottom range after a significant price drop. Its key distinction lies in meeting three conditions: a substantial deviation from long-term valuation, signs of improving liquidity, and macro policy support. It focuses on opportunities during periods of excessive market pessimism and must be paired with strict position sizing and stop-loss mechanisms, rather than simply buying whenever prices fall.
Q2. Is bottom fishing suitable for all traders?
Bottom fishing is a high-risk strategy that requires in-depth market research and the ability to withstand sharp volatility. It is not necessarily suitable for all traders.
“Forex trading involves high risk and may result in the loss of your capital. The content of this article is for informational purposes only and does not constitute investment advice. Please make prudent decisions based on your personal financial situation. Cashback Island assumes no liability for any trading-related consequences”.
In the realm of modern financial market analysis, whether it’s the fast-changing forex market, the highly volatile cryptocurrency space, or traditional stock indices, technical analysis plays an indispensable role. Among the many technical indicators, the Relative Strength Index (RSI) is undoubtedly one of the most classic and widely used tools....
In today's environment of persistently low interest rates combined with inflationary pressures, simply depositing money in the bank is no longer sufficient to preserve the future value of your assets. An increasing number of investors are seeking more proactive ways to grow their wealth, shifting from traditional savers to active...
In the fast-paced world of financial markets, price movements tend to capture most of the attention. Yet, just like a detective following clues, focusing only on the footprints (price) while ignoring their depth and density can lead to missing critical information. That often-overlooked dimension is trading volume. More than just...